The Printing Industries Sales Compensation Study was conducted this past spring as a joint effort of the regional affiliates to allow members to benchmark best-in-class sales compensation practices, policies and benefits. The graphs and plots in this report, available to PIA members on request (email info@printcommunications.org to get your copy), help the reader to compare their company’s policies and compensation practices with industry averages. What are some of the key findings?
Focus on High-Performers
First, the data shows there are some excellent high-performing sales representatives in the field. These reps skew means above the medians, as shown in the plots throughout the report. If you have one or more of these sales professionals who have exceptional sales performance, you have a winner and will want to keep them in your organization. Maintaining sales volume, particularly in markets with limited growth potential, is critical.
Among the ways to help retain these high-performers is to look for ways to improve their work life. This could mean bringing in support personnel, whether subject matter expertise or inside CSR or account management. Further, investing in additional marketing tools or marketing automation, may provide important support for these high-performers.
Simple strategies, including investing in client appreciation campaigns are often important to high-performers, as these reps are typically very focused on client satisfaction. It is important to see these reps as client advocates and employ strategies that help them advocate better for their account base.
For low-performers, providing appropriate training and mentorship, as well as using meaningful metrics and incentives, is important to help develop these reps into high performing sales professionals.
Focus on Total Comp as a Percentage of Sales
Top ranked sales representatives have a Total Compensation as a Percentage of Sales (Comp/Sales) metric at or below 9%. That means for every $90k total compensation (salary+commission), they are producing a minimum of $1M in sales. Mean Comp/Sales really falls off for low-performing reps. In this report, sales reps in the 50th percentile and above all had Comp/Sales metrics below 10%, while the 25th percentile reps averaged 17.2%, and the bottom reps averaged 67.5%.
The advantage of focusing on a single metric like Comp/Sales and tying bonuses/incentives to this metric, is that it directly connects salary and commissions (i.e. labor cost) to a single measurement that reps and management can use for benchmarking.
In some organizations, having different Comp/Sales targets may be appropriate too. For example, if margins are higher for Wide/Grand Format printing, than perhaps a target of 15% makes sense for new reps. For Heatset Web Offset, where margins may be lower, a 5% Comp/Sales target may be appropriate.
For more advanced sales organizations, one may develop a Total Compensation to % Value-Add metric, which may provide additional insight for sales compensation benchmarking.
10 Years Sales Experience…All that is Needed
Sales experience is often relied upon when hiring new reps. However, the data shows in this report that somewhere after 5 to 10 years’ experience, there is little correlation between years of service and sales volume. The plot below uses a Power Model trend line, where both variables (sales volume and years’ experience) are transformed by the natural log before estimation of the model. These values are then exponentiated to plot the trend line. You will notice that between 0 and 5 years, the slope is noticeable. Somewhere between 5 and 10 years that slope flattens and remains mostly flat the rest of the way.
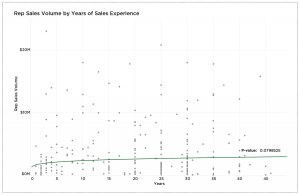
This plot corroborates another chart in the full report related to years of experience by rep rank. Years of experience appears to only be a valuable metric for hiring reps with less than 10 years’ experience. There were plenty of examples of low-performing reps with more than 25 years’ experience in the collected data set. Similarly, there are many high-performing reps with less than 25 years’ experience. Years of experience is not terribly meaningful, once a rep has around 10 years’ experience.
This plot also helps us understand how important mentorship and training is during the early years of one’s career. Early-career sales reps need clear, structured development to build a customer base.
Company Size Matters
Large companies exhibit better sales performance throughout this report. While there were high-performing outliers in all company sizes, larger organizations showed better mean and median sales performance in most categories. Reps at larger companies achieve better sales performance. As such, sales reps are more highly-compensated in companies with sales volumes greater than $30M.
Having said that, clearly niche businesses showed strong sales performance. This was evident in the Web Offset (Heatset) process for ≥$5m – $15M companies. While there are limited data points in this and similar segments, it is clear that some strong businesses and sales reps are present in both large and small companies.
Revisit Value-Add
Value-add as a management principle —improvements added to raw materials to increase their value to customers—remains mostly unincentivized in the printing industry. Only 12% of respondents use % of value-add as the basis for calculating commissions for standard work. That number goes up to 18% for discounted work.
Value-add is key to productivity and profitability. Using value-add as an incentive for sales compensation promotes jobs with large amounts of in-house work. When compensated a such, sales reps focus their energies on acquiring work with high percentages of value-add. As noted earlier, this helps keep a company’s employees and equipment busy.
It may be that many print companies do not readily track value-add for jobs, or perceive difficulty in calculating VA for each bid. At a minimum, VA would be a great way to offer incentives/bonuses to reps on a quarterly or yearly time frame. In time, reps and sales managers will gain an understanding of the significance of value-add for organizational productivity and profitability.
Differentiate with Marketing Support
While the majority of companies surveyed for this study employed Customer Service Representatives (CSRs) and Sales Managers, relatively few had on-staff marketing personnel (39%) or utilized outside marketing services (17%). One of the best ways to help low-performing sales reps is to help them with prospecting. Employing marketing strategies is a great way to keep fresh leads coming into your sales organization.
Related, only 11% of the respondents used commercially available Marketing Automation Platforms such as Hubspot, Salesforce/Pardot, etc. While relatively expensive, these systems provide automated workflows such as triggered emails and personalized landing pages, to assist in the sales process. Adding a coordinated marketing effort to support and compliment sales professionals may be an excellent way to differentiate organizations in tight markets.
Conclusion
We hope you find this report valuable as you benchmark your organization’s sales performance, compensation practices, sales policies, and benefits. Whether hiring, promoting, or reviewing sales performance, the use of this report and the graphs and plots contained therein, will improve the sales management within your organization. We hope this study helps you develop innovative incentive plans to improve overall sales performance in your organization. PIA members can email info@printcommunications.org to request a copy of the full report.
Questions? Contact Tim Freeman at tim@printcommunications.org or (716) 691-3211.
Tim Freeman, President
Print & Graphic Communications Association
office: (716) 691-3211
cell: (716) 983-3826